Innovations – Case Study
Transportation Authority
Gets Up to Speed
Improving access to performance data
The Challenge
Provide timely, detailed information
A public transportation authority for a large metroplex recently asked Daman for help in developing a business intelligence (BI) solution to help them share key information with both internal and external constituents.
The client was struggling to generate and distribute reports about service levels, safety records, financial status and other performance areas. For executive meetings and board presentations, most attendees used basic PowerPoint slides and spreadsheets, which were then posted as static documents on the client’s public website.
This approach limited transparency as required by regulations and made it harder for the general public, state employees, legislators, and journalists to readily access the information they needed about the transportation authority. Updates in real-time were unavailable, and additional information had to be requested from the client on an ad hoc basis. Data quality was another challenge — about 50 percent of their performance data was received from external parties, and much of this data was of poor quality.
The client knew that they needed a better way to effectively generate and visualize data inside a standard 1920×780 screen format. Their website had to provide a rich and engaging experience for a wide variety of users, comply with regulatory laws such as the Americans with Disabilities Act (ADA), perform complex metrics, and support the on-the-fly execution of calculation rules.
As a final challenge, any upgrades needed to be developed within the context of the client’s existing BI tool, even though this tool provided only limited support for specific visualizations and didn’t preserve data context when users navigated from one screen to the next.
In short, the client needed a fast, engaging and convincing way to “tell their story” to the public and clearly explain their essential services and how they provide these services in a reliable, efficient and financially responsible manner.
How Daman Helped
Creating a Performance Dashboard
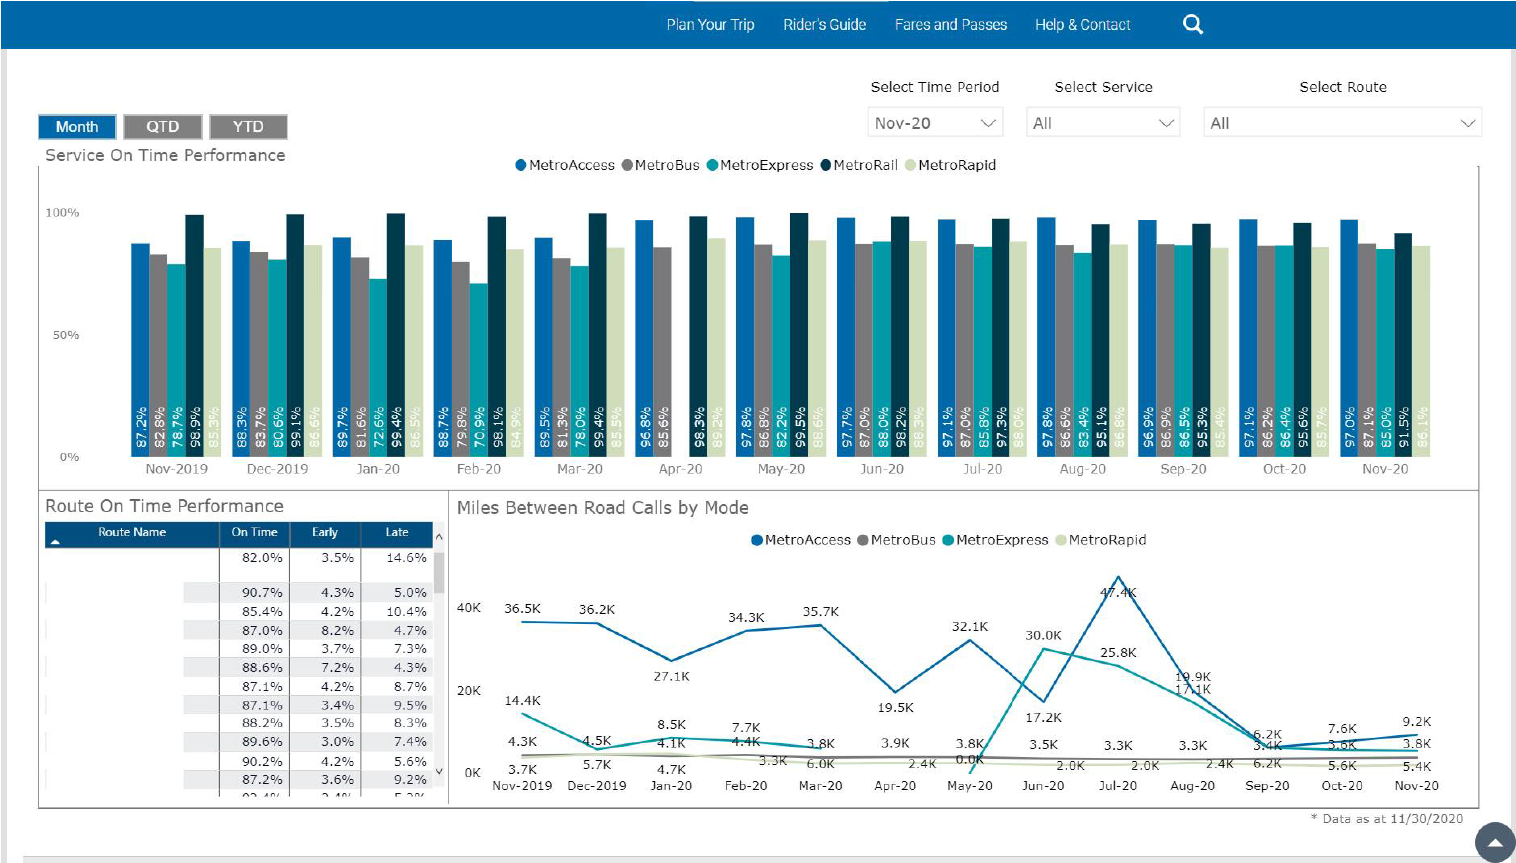
To address these challenges, Daman presented a plan to develop a data warehouse solution that would support a public-facing, interactive, performance dashboard.
Working under tight deadlines, Daman built a data warehouse solution with data sets linked directly to corresponding dashboards. To improve data quality, we performed complex data archeology and implemented an extensive set of data-quality rules. Metrics calculations were also redefined and re-categorized. In addition, Daman professionals performed customized coding with the client’s BI tool to help improve visualizations and preserve data context when users move from one dashboard screen to another.
At every step of the way, enhanced usability was a top priority. For example, we knew that different users would interact with the dashboard in different ways, so we conducted a number of focus groups, asking key questions about user needs, capabilities and assumptions in navigating through a web-based dashboard. The result is a sophisticated yet easy-to-use dashboard appropriate for both novices and experienced researchers. It provides summary information as well as the capability to rapidly access different data sets or drill down to increasingly granular levels of information.
Daman also aligned visuals to support keyboard-based navigation and implemented a security framework to manage data access for internal and external constituents. Data Analysis Expressions (DAX) language was used to integrate complex data engineering into the dashboard layer since the calculations were dependent on the level and type of querying performed on the dashboard.
The Results
A self-service BI solution

The client now has a true, self-service BI solution for internal and external data requests. In effect, the dashboard presents or “pushes out” timely information instead of requiring users to “pull in” information by digging through static reports and presentations.
With the dashboard, the client is able to better —
- serve the information needs of almost anyone interested in or dealing with the client
- display data lineage and provide metadata — an exceedingly important capability for public entities subject to regulatory requirements
- improve transparency in providing a large amount of accurate and up-to-date information that was previously unavailable to the public
- support executive leadership in decision making with specific enablement provided to the board
- reduce the burden on inhouse staff in answering questions from legislators, researchers, the public and the media
- position the client as a forward-looking, well-organized and consumer-focused service provider.


